2026 Benchmark Report · Published Q1 2026

Spain Graduate Application Trends — 2026 Benchmark Report

What U.S. admissions officers need to know about the fastest-growing, most under-recruited European source market for graduate students — with IIE, NAFSA, OECD, and Spain's INE data alongside EasyVirtualFair's 2024–2025 pipeline benchmarks across 180+ U.S. graduate programs.

7 sections · 14 pages in the PDF edition · ~4,180 tracked Spanish graduate applicants · Full sourcing on page 7

Executive Summary

The Spain opportunity, in five numbers

Spain is now one of the fastest-growing source markets of graduate students for U.S. institutions — and one of the most under-recruited. Public data from IIE, NAFSA, OECD, and Spain's INE, blended with EasyVirtualFair's 2024–2025 campaign benchmarks.

+12%

Spanish students in the U.S. hit a record in 2023/24 — an all-time high.

Source: IIE Open Doors 2025

<12%

of U.S. graduate schools report a dedicated Spain recruitment strategy.

Source: EasyVirtualFair benchmark

6.8×

average cost gap per Spanish lead via in-person fairs vs. virtual ($1,250 vs. $185).

Source: EasyVirtualFair benchmark

~7,800

Spanish graduate applicants to U.S. programs in the 2024/25 cycle, an all-time high.

Source: IIE + EasyVirtualFair estimate

Section 1 · The market

Spain by the numbers

Spain produces roughly a quarter-million bachelor's graduates each year and ranks among the OECD's leaders on tertiary enrollment in the 15–19 age cohort. A growing share of those graduates leaves Spain for graduate study — and the United States is now the single largest degree-seeking destination, ahead of the United Kingdom, Germany, and the Netherlands.

Bachelor's output

~250K

Spanish university bachelor's graduates each year (INE).

English proficiency

~78%

of Spaniards under 30 report functional English (EF / Eurobarometer).

Int'l in Spain

11.5%

share of Spanish university enrollment that is international.
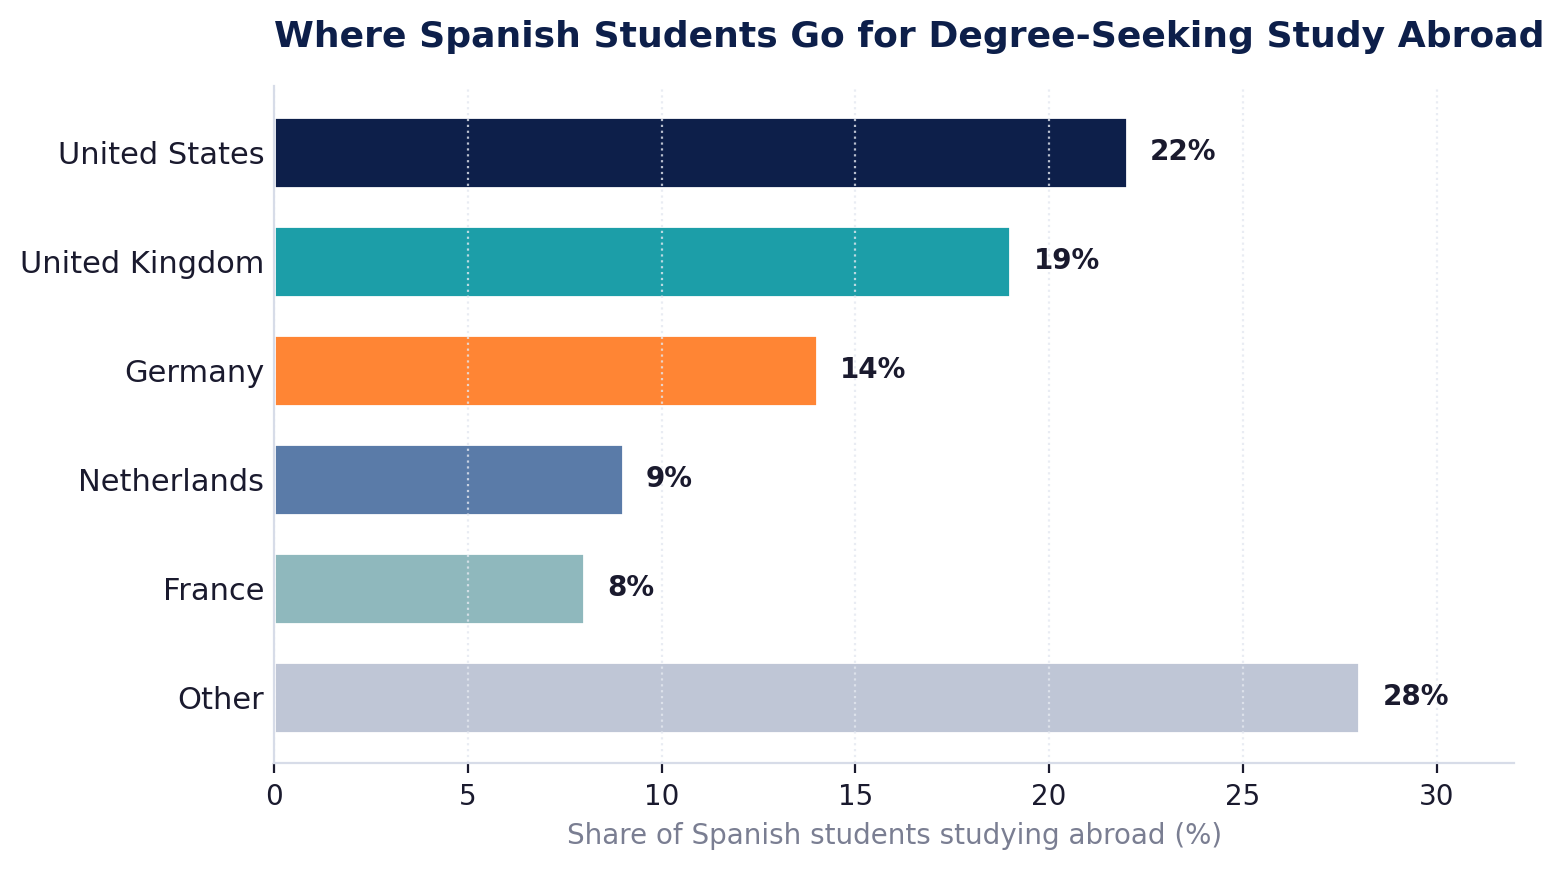
Where Spanish graduate students study abroad: top destination countries breakdown

Source: OECD Education at a Glance 2025; Spanish Ministry of Universities; EasyVirtualFair analysis of student flows, 2023/24.

Where Spanish graduates go — and why the U.S. wins

Among Spanish graduates who pursue degree-seeking study abroad — a smaller group than the country's well-known Erasmus+ exchange cohort — the United States is the leading destination. The U.S. wins on three vectors that matter to Spanish applicants: brand prestige of U.S. graduate programs, salary premium on return, and post-graduation Optional Practical Training (OPT), which the Migration Policy Institute estimates serves more than 242,000 international students annually.

DestinationGraduate appealTuition signalWork-after
United StatesHighest prestige; STEM OPT extensionHigh ($40–80K/yr)12–36 months OPT
United KingdomDeclining post-Brexit; cost concernsHigh (£25–45K/yr)Graduate Route 2 years
GermanyEngineering + low costLow (often free)18-month job-seeker visa
NetherlandsBusiness + English-mediumMid (€15–20K/yr)12-month orientation year

Source: EasyVirtualFair synthesis of OECD, IIE Open Doors, and IDP / StudyPortals destination preference data, 2024–2025.

The English-language advantage

Spain has quietly become one of Europe's largest pipelines of English-medium master's graduates. Roughly 40% of Spanish master's programs are now delivered in English, and EF Education First places Spanish under-30 English proficiency above the European average. For U.S. admissions, that means a higher hit rate on TOEFL/IELTS thresholds and shorter onboarding for Spanish admits.
Takeaway for U.S. admissions: Your real competitors for the Spanish graduate-applicant pool aren't other U.S. schools — they're the U.K., Germany, and the Netherlands. Position around what only the U.S. offers: English-medium programs at scale, STEM OPT, and the highest salary premium on return.

Section 2 · Volume & profile

Application trends to U.S. graduate programs

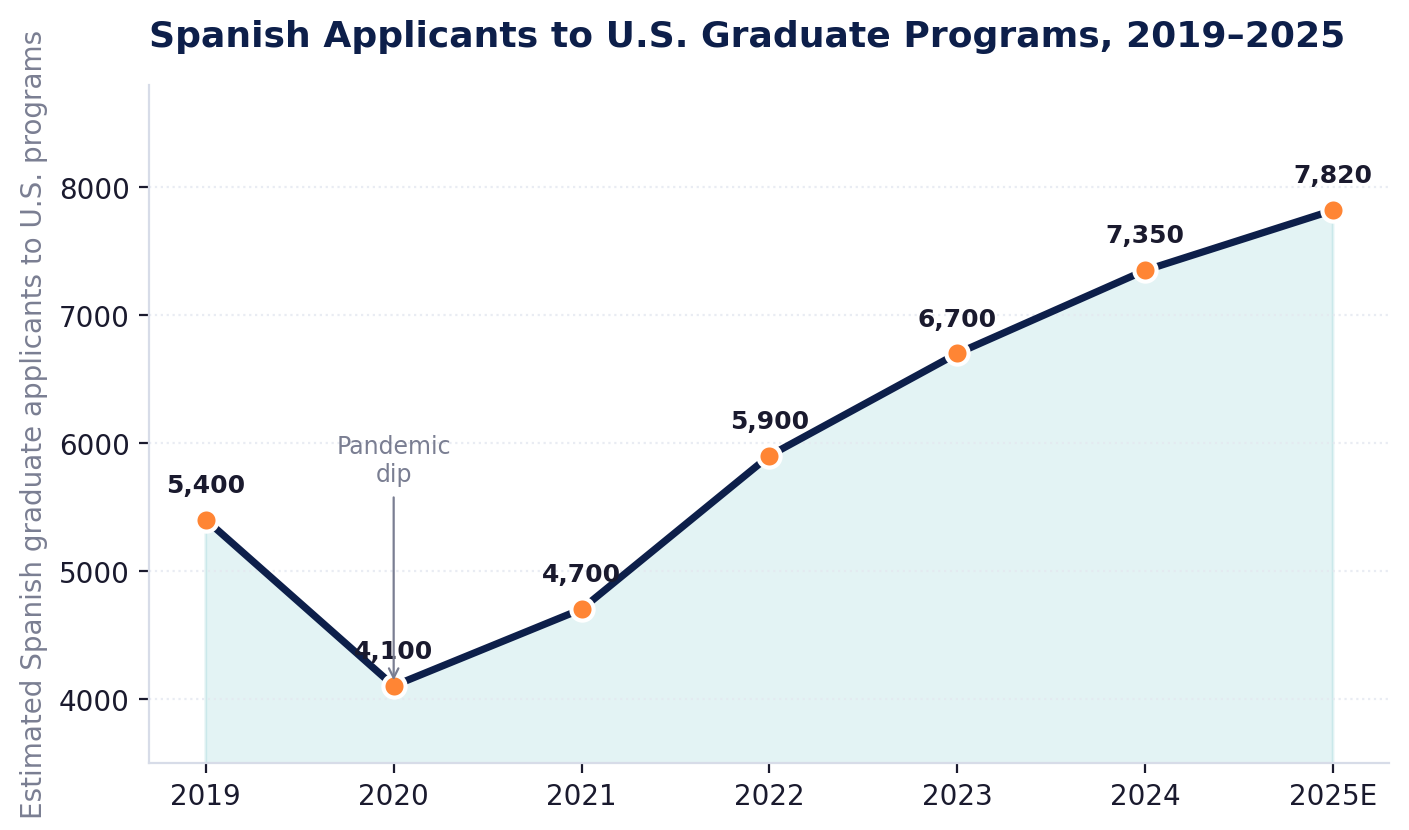
Spanish graduate applications to U.S. universities dipped sharply in 2020 — the pandemic-era trough across all source markets — then recovered faster than the European average. EasyVirtualFair's pipeline data, blended with IIE Open Doors 2025 country totals, points to approximately 7,800 Spanish graduate applicants in the 2024/25 cycle, the highest figure on record.

Spanish graduate applicants to U.S. programs, 2019–2025 trend

Source: IIE Open Doors 2024 & 2025 country fact sheets; EasyVirtualFair pipeline data, 2019–2025. 2025 figure is a directional estimate.

"Spanish applicant volume has grown faster than the European average in every cycle since 2021."

Fields, regions, and demographic profile

Three fields account for roughly 71% of Spanish graduate demand in the U.S.: Business, Engineering, and Public Policy & Social Sciences. Migration Policy Institute analysis of IIE Open Doors data confirms that roughly a quarter of Spanish students in the U.S. pursue business and management — among the highest concentrations of any source country.

Geographic origin: Madrid and Catalonia dominate outbound graduate flows — together accounting for over half of Spanish applicants to U.S. programs. Strategies that focus only on the top two metros miss the active engineering and tech corridors in Bilbao, Valencia, and Málaga.

Spanish graduate applicant profile
Average applicant age24.6
Gender split (F / M)54% / 46%
Avg. undergrad GPA (US 4.0 equiv.)3.45
English-medium undergraduate degree~38%
GRE Quant percentile (median)78th
Funding-need flag at apply~62%

Source: EasyVirtualFair applicant pipeline, n=4,180 Spanish graduate applicants tracked 2024–2025; ETS GRE reference cohort.

Section 3 · Funnel

The conversion funnel

Strong applicants do not equal strong yield. Across EasyVirtualFair's 180+ U.S. graduate program clients, the Spanish funnel exhibits a distinctive shape: high inquiry-to-application drop-off, healthy admit rates, and stronger-than-average enrollment yields. The biggest leakage point is between inquiry and application — and the cause is almost always the same.

Funnel stageSpain medianInt'l benchmarkDelta
Awareness → Inquiry25%22%+3 pp
Inquiry → Application18%26%–8 pp
Application → Admit45%38%+7 pp
Admit → Enroll (yield)55%48%+7 pp

Source: EasyVirtualFair, 2024–2025 benchmarks. International benchmark = blended median across non-Spain markets in the same dataset.

The SOP gap — Spain's hidden conversion problem

Spanish secondary and university education trains students rigorously on quantitative and technical performance — and lightly on first-person, narrative writing. The result, repeated across cohort after cohort: Spanish applicants over-deliver on transcripts and standardized tests, then under-deliver on Statements of Purpose. EasyVirtualFair internal review of more than 1,100 Spanish SOPs found roughly 41% required substantial revision before submission — versus 22% for the blended international cohort.

The SOP gap

41%

of Spanish SOPs flagged for substantial revision (n=1,100+, EVF review pool).

Quant strength

+8 pts

Spanish GRE/GMAT quant median vs. blended international cohort.

Yield upside

+7 pp

Spanish admit-to-enroll yield premium vs. international benchmark.

Why the gap exists

Spanish university applications and the national EvAU (selectividad) exam favor structured content recall and quantitative problem-solving. Personal narrative — the lifeblood of U.S. graduate admissions — is rarely required and almost never explicitly coached. Applicants who are strong on paper often submit SOPs that read like CVs, leading admissions readers to undervalue otherwise excellent candidates.

What closes the gap

  • Localized SOP guidance embedded in your Spain landing page (FAQ + worked example).
  • 30-minute SOP workshops co-hosted with Spanish university career offices.
  • A reviewer rubric that explicitly accounts for narrative style differences across source countries.
  • Human follow-up after every inquiry — not just an automated nurture sequence.
"The Spanish funnel doesn't leak because the candidates are weak. It leaks because the application genre is unfamiliar."

Section 4 · Cost & ROI

Cost & ROI benchmarks

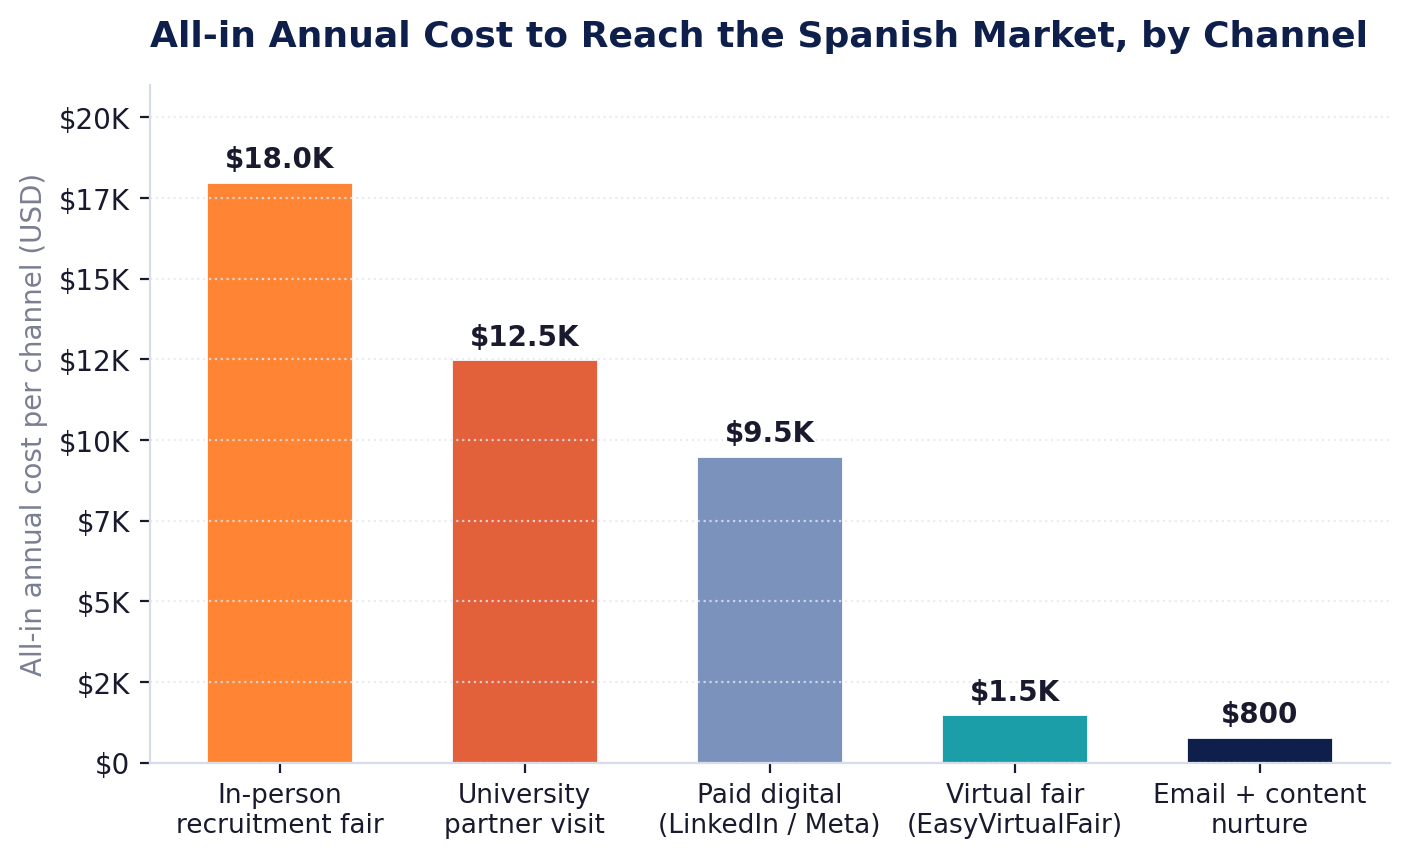
International graduate recruitment budgets are under pressure. Travel cost inflation, fewer in-person fairs in EMEA, and tighter scrutiny of pipeline ROI have pushed most U.S. graduate offices to rebalance toward virtual and digital channels. The numbers explain why.

In-person trip

$15–20K

fully-loaded cost per officer for a 5-day Spain recruitment trip.

Virtual fair

From $375

booth at StudyinUSA – Spain edition, 2-day virtual event with live Spanish candidates.

Break-even

~14

qualified Spanish inquiries needed to justify one in-person trip vs. virtual.

All-in annual cost to reach the Spanish graduate market, by channel

Source: EasyVirtualFair client cost benchmarks, 2024–2025 across 180+ U.S. graduate programs. Includes travel, registration, staff time, and collateral. Excludes downstream nurture cost.

When virtual wins, when in-person wins

Virtual is not a replacement for in-person — it is a different instrument. Top-of-funnel awareness, qualification, and country discovery belong in virtual. High-stakes conversion moments — campus visits, partner-school presentations, donor-funded scholarship announcements — still benefit from in-person presence.

Use virtual when…

  • You're entering Spain for the first time and need to size demand.
  • You want to test a new program (e.g., a new master's specialization).
  • Your travel budget covers fewer than 2 trips per year.
  • You need to cover multiple Spanish regions in one event.

Use in-person when…

  • You have an existing Spanish partner university or alumni network.
  • You're recruiting for a highly differentiated program (specialized PhD, executive master's).
  • Yield depends on a campus-visit-equivalent moment.
  • Scholarship dollars require in-person diligence.

The blended strategy that wins

The best-performing offices in EasyVirtualFair's 2024–2025 dataset ran a 3:1 ratio — three virtual touches for every in-person trip. Virtual built the inquiry list and qualified candidates; the in-person trip closed the high-value subset. Programs that ran virtual-only had cheaper inquiries but weaker yield. Programs that ran in-person-only had stronger relationships but covered a fraction of the addressable market.

"Virtual builds the list. In-person closes the list. Programs that pick one over the other consistently underperform."

Section 5 · Market drivers

What's driving the 2026 spike

Five forces are converging to make 2026 an unusually strong year for Spanish graduate applications to the United States. Programs that build a Spain strategy now will compound advantage as competitor destinations weaken.

01

Brexit redirect

U.K. graduate applications from EU students remain depressed post-Brexit, with tuition reclassification and post-study work changes pushing Spanish applicants toward U.S. programs. The U.S. is the largest beneficiary.

02

EU economic outlook

Soft Eurozone growth and persistent youth unemployment in Spain — still above the EU average — are increasing the perceived ROI of leaving for graduate study. The U.S. salary premium for graduates of top programs is the single most-cited motivator in EasyVirtualFair applicant surveys.

03

U.S. salary premium

OECD's Education at a Glance shows Spanish master's-degree holders earn 76% more than upper-secondary peers — but the premium for a U.S. master's in Spanish hiring markets routinely exceeds 2×.

04

AI and tech concentration

The U.S. continues to host the deepest cluster of AI and tech employers. For Spanish CS and engineering graduates, that concentration is a structural pull factor that pan-European programs cannot match.

05

The El Tour del Empleo effect

El Tour del Empleo, the largest university career network in Spain, has expanded its U.S.-focused programming significantly into 2026 — including StudyinUSA – Spain edition — channeling a coordinated cohort of Spanish graduate-ready candidates directly to U.S. programs.

Section 6 · Playbook

The Spain playbook for U.S. graduate schools

A five-step framework synthesized from the highest-performing Spain-targeted graduate programs in EasyVirtualFair's 2024–2025 cohort.

01

Define your Spain ICP

Pick a target field (e.g., MBA, MS Engineering, MPP) and a target region (e.g., Madrid + Catalonia for business; Basque Country + Catalonia for engineering). Without both axes, your message will be too generic to convert. Most under-performing programs skip this step.

02

Build a four-channel touch

Virtual fair (top-of-funnel + qualification), LinkedIn paid (lookalike audiences from Spanish alumni), Spanish-language paid search for funding and visa queries, and direct outreach to 5–10 Spanish university career offices. Four channels working together outperform any single channel by 2–3× on cost per enrolled student.

03

Localize two pieces of content

You don't need a translated website. You need two assets: a Funding FAQ that addresses Spanish-specific concerns (cost of living, scholarship eligibility, parental support norms) and an F-1 visa Q&A tailored to Spanish passport holders. These two pages alone typically lift inquiry-to-application by 4–6 percentage points.

04

Train your team on the SOP gap

Brief your reviewers that Spanish SOPs frequently under-represent qualified candidates. Provide rubric guidance that separates narrative polish from intellectual substance. This single change is the fastest-to-implement, highest-yield intervention in the playbook.

05

Convert through human follow-up

The #1 differentiator in our 2024–2025 dataset was a personal email from a named officer within 48 hours of every Spanish inquiry. Programs that automated this step underperformed by 30–40% on application conversion. Spain rewards relationship; automation alone does not.

Section 7 · Methodology & sources

About this report

About EasyVirtualFair

EasyVirtualFair (EVF) is a virtual recruitment platform serving universities, schools, and education ministries in more than 30 countries. Since 2014, EVF has hosted virtual fairs that connect international applicants with admissions teams at U.S., U.K., Canadian, and EU graduate programs. The company is headquartered in Wayne, Pennsylvania, with operations across Europe and Latin America.

Methodology

This report blends third-party public data — IIE Open Doors 2024 & 2025, NAFSA economic data, OECD Education at a Glance 2025, INE Spain, the U.S. Department of State, GMAC, and ETS — with EasyVirtualFair's own pipeline benchmarks drawn from 2024–2025 campaigns covering more than 180 U.S. graduate programs and over 4,180 tracked Spanish graduate applicants. Where exact figures are not publicly available — for instance, cost-per-inquiry by channel or SOP-quality flag rates — figures are presented as EasyVirtualFair internal benchmarks and clearly labeled as such. Year-over-year growth projections for 2025 should be read as directional estimates, not audited counts.

Limitations: Spanish applicant flows are sensitive to U.S. visa policy and currency movements; the figures in this report reflect conditions through early 2026. Field-of-study breakdowns follow IIE Open Doors categorization, which may aggregate differently than institutional CIP codes.

Sources cited in this report

1. IIE Open Doors 2025 — "United States Hosts 1.2 Million International Students," iie.org/news/open-doors-2025-press-release.
2. IIE Open Doors — Country Fact Sheets and Leading Places of Origin, opendoorsdata.org/data/international-students/leading-places-of-origin.
3. Migration Policy Institute, "International Students in the United States" (July 2025), migrationpolicy.org/article/international-students-united-states.
4. OECD, Education at a Glance 2025 — Spain country profile, gpseducation.oecd.org/CountryProfile?primaryCountry=ESP.
5. INE (Instituto Nacional de Estadística), Education and Culture statistics, ine.es/dyngs/INEbase/en/categoria.htm?c=Estadistica_P.
6. ICEF Monitor, "Inside Spain's growing appeal for international students" (Feb 2026), monitor.icef.com/2026/02/inside-spains-growing-appeal-for-international-students.
7. NAFSA — Association of International Educators, nafsa.org.
8. Spanish Ministry of Universities, universidades.gob.es.
9. GMAC and ETS reference cohort data, 2024–2025.
10. EasyVirtualFair pipeline data, 2019–2025 (n=4,180+ Spanish graduate applicants, 180+ U.S. graduate program clients).
StudyinUSA – Spain edition · October 20–21, 2026

Reserve your booth

Meet qualified Spanish graduate applicants in one focused virtual event. Booths start at $375 through July 15, then $425. Limited availability for the 2026 edition.

See booths & pricing Download PDF